Protein Structure Predict User Guide
1: Introduction to the algorithm
Predicting the 3D structure of a protein from it's amino acid sequence is called protein structure prediction, which is one of the most important goals pursued by bioinformatic scientists and theoretical chemists. Protein structure prediction is a very important tool in medicine (for example, drug design) and in biotechnology (for example, the design of new enzymes).
In order to accurately predict the protein structure, the Tencent AI Lab team developed the tFold protocol, a new ‘de novo folding’ method including three technological innovations, to greatly improve the accuracy of protein structure prediction, especially for those hard targets.
First, we developed a multi-source fusion technology to mine the co-evolutionary information in multiple sets of Multiple Sequence Alignments (MSA); then, with the help of a deep cross-attention residual network, we may significantly increase the prediction accuracy of some important 2D structural information such as the residue-residue distance and orientation matrix of the protein structure; finally, we effectively merge the structural information embedded in the 3D models generated by Free Modeling (FM) and Template-based Modeling (TBM) via a novel Template-based Free Modeling (TBFM) approach, which greatly improves the final 3D Modeling accuracy.
2: Start to Use
2.1 Enter the amino acid sequence for prediction (required)
iDrug provide two input methods for amino acid sequence, one is to edit directly through the text box, and the other is to upload FASTA files locally. Please choose one of the two methods accordingly. Both methods check the validity of the input, including:
1) It can only be entered in uppercase letters. Non-standard amino acid characters (ie: B, J, O, U, X, Z) are not supported.
2) The currently allowed amino acid sequence length ranges from 30 to 800 residues.
3) Multiple sequences can be submitted at one time. Multiple sequences are divided by a line beginning with '>' and the content after '>' is used as the sequence name of the next sequence.
-
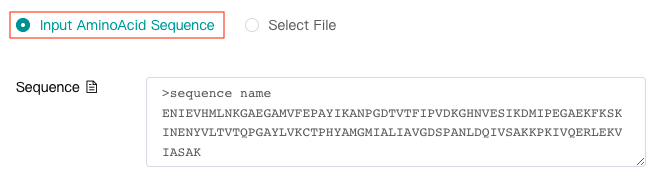
Enter amino acid sequence via text box (The following figure shows a legal input amino acid sequence.)
-
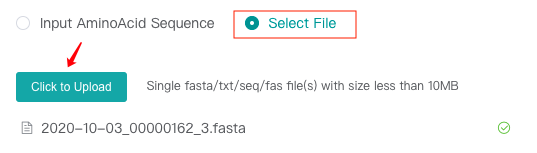
Upload FASTA files locally
2.2 Enter the task name (optional)
Users can choose to enter the task name in the "Task Name" text box. If not entered, the website will use the randomly assigned UniqueID as the task name.
2.3 Submit task
After completing the above steps, click the "Predict" button. If "Your task has been created successfully!" is displayed, the submission is successful.
If the task is completed successfully, the user's registered mailbox will receive email of task completion notification. Usually, the calculation time of a task ranges from half an hour to several hours.
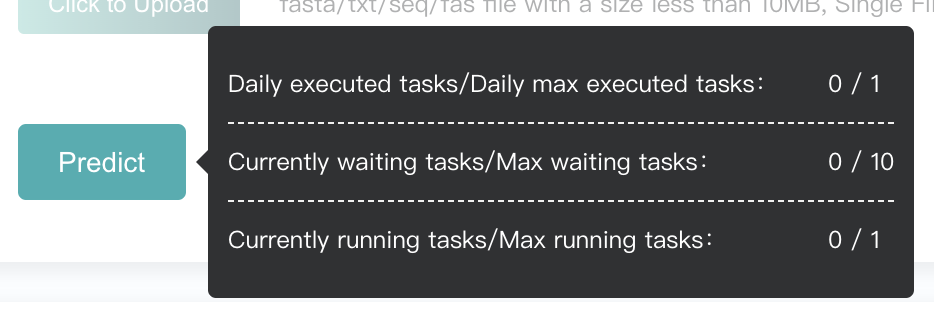
In order to allocate the limited resources reasonably, we limit the user's task quota. Hover the mouse over the "Predict" button to see the restriction and usage. The "Predict" button will be disabled when quota is insufficient.
2.4 Query history
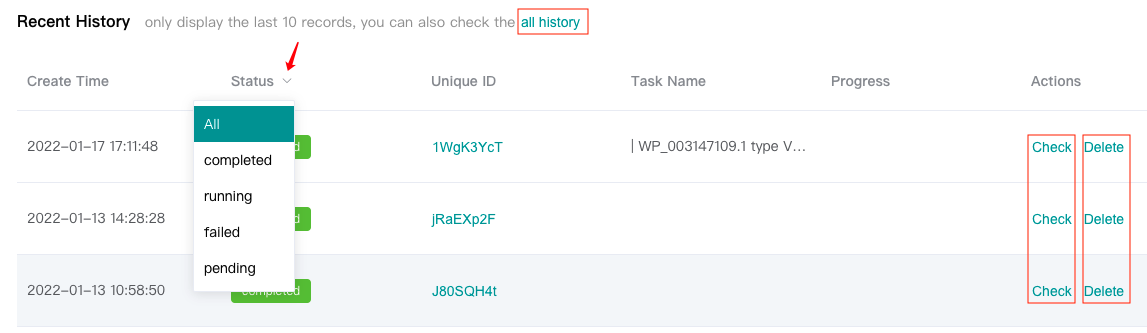
Users can view the "Recent History" below, which only displays the last 10 history records, or click the "all history" to see all history records.
Users can "Check" completed tasks (marked in green).
Users can "Delete" completed or failed or pending tasks. Tasks in running status can not be deleted.
Click the drop-down arrow next to "Status" to filter according to the task running status.
2.5 Download results
-
Click "Download all results" to download all calculation results in the result interface, or click "Download only PDB files" to download only predicted protein structrue files:

-
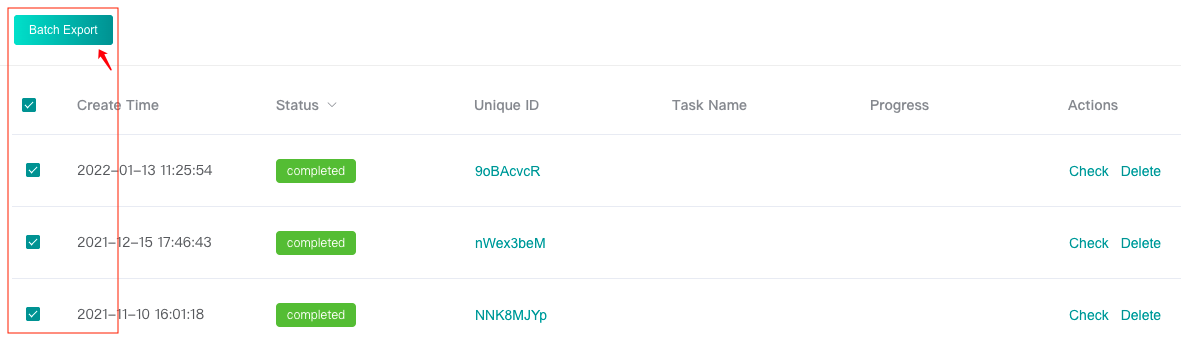
Download task results in batches in the history page:
3: Prediction results
tFold will display the results of protein structure prediction in three parts, namely:
Unlike other protein structure prediction servers that use the 'de novo folding' method, our tFold server displays the three important steps of the complete 'de novo folding' step to users in full details. During the display process, users will understand how the tFold algorithm extracts co-evolutionary information from the initial Multiple Sequence Alignment (MSA) step by step, and then passes this information through the Deep Cross-Attention Residual Network (DCARN) predicts the residue pair distance matrix, and finally uses the matrix to fold the three-dimensional structure.
3.1 Predicted results of two-dimensional structural features of proteins
The residue-residue distance matrix is an important two-dimensional structure feature of a protein, which can effectively assist the 'de novo folding' to obtain the three-dimensional structure. The content displayed on the results page of tFold's 2D modeling is to tell users how we can extract the co-evolutionary information from Multiple Sequence Alignments (MSA) into the Markov Random Fields (MRF) matrix (left figure), and accurately predict them through the Deep Cross-Attention Residual Network (DCARN) to residue-residue distance matrix (right figure).
In order to further show the details, we can select a given 30*30 area to zoom in, and display the enlarged details in the lower middle small square. If you click on a certain <i, j> position in the 30*30 area, we will display the co-evolution information (left figure) or distance distribution (right figure) of a given residue pair <i, j> in the upper middle small square.
3.2 Predicted results of protein three-dimensional structure
The ab initio folding (also known as Free Modeling, FM) of the 3D structure by tFold is achieved through the predicted residue-residue distance matrix (as shown in the previous 2D modeling). In short, we first convert the predicted distance distribution into an energy function, and then use the energy minimization method to perform efficient 3D structural modeling.
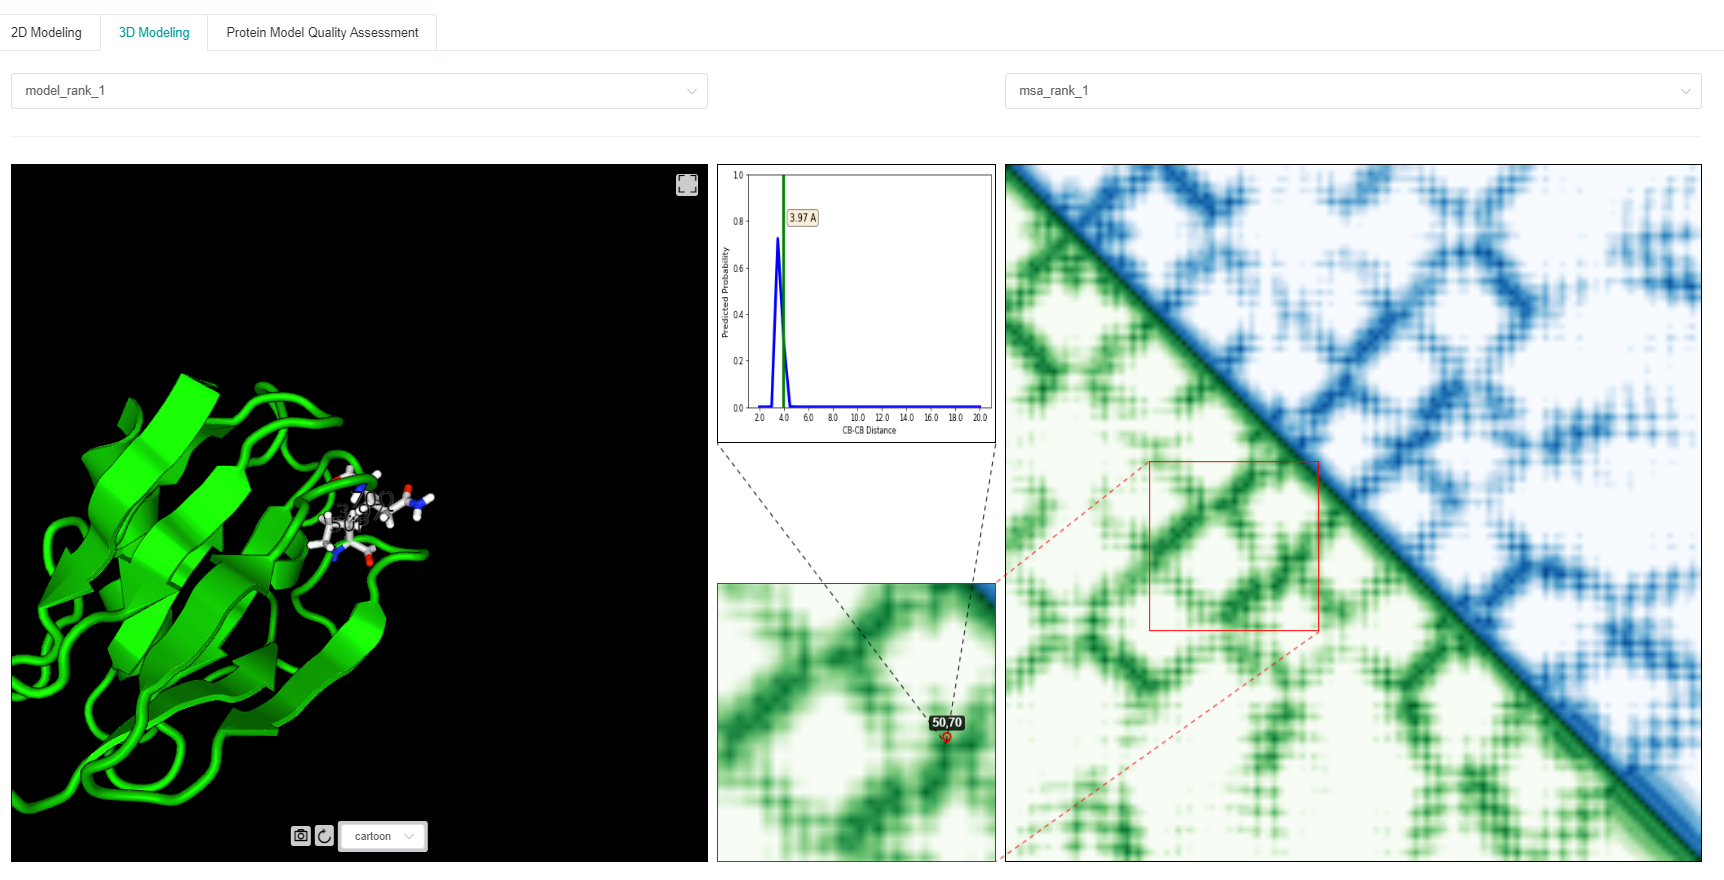
We display 3D structure models with the best energy in the left figure, and display its distance matrix in green in the lower triangle part of the right figure. The blue part of the upper triangle on the right figure is the predicted residue-residue distance matrix from a certain MSA. In order to observe the deviation of the 3D structure from the predicted distance distribution at a given <i, j> position, we display the specific information of the two in the upper middle small square. As shown in the figure above, at the position <50, 70>, the distance of the 3D model is 3.97Å, which is in line with the predicted distance distribution.
When there exist structural templates, tFold adopts a novel Template-based Free Modeling (TBFM) approach to effectively merge the structural information embedded in the 3D models generated by Free Modeling (FM) and Template-based Modeling (TBM), which greatly improves the final 3D Modeling accuracy. (Currently the server module is still under development. If you need it, you can contact the tFold R&D team offline.)
3.3 Predicted results of protein model quality assessment
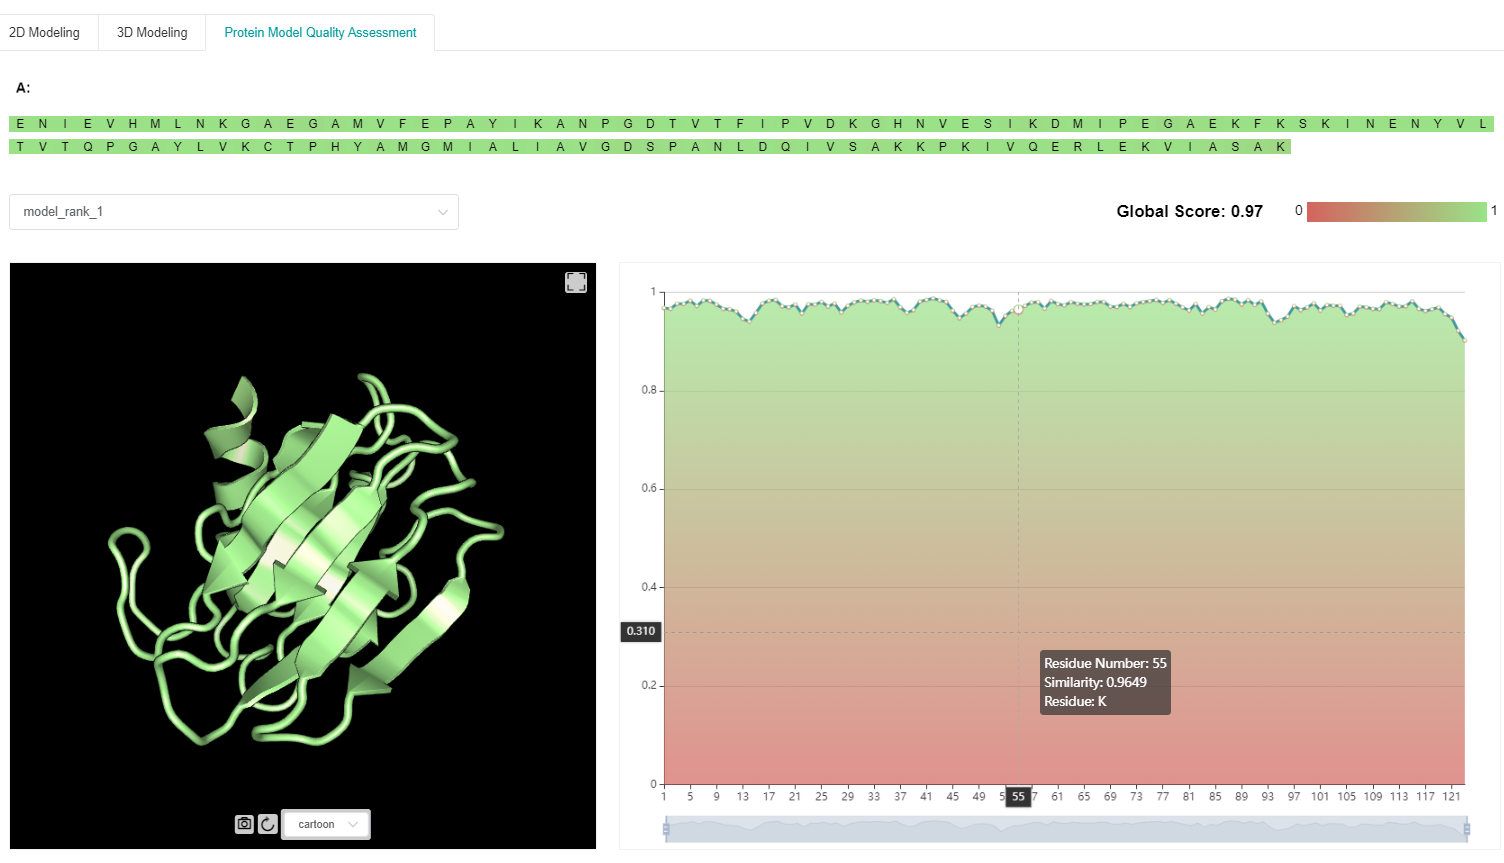
Due to the diversity of computation-based protein structure prediction results, model quality assessment (MQA) can help to identify the most likely predicted structure(s) as the final output(s).
In this module, both single- and multi-model features are extracted from candidate structures, supplemented with structural homologs and our in-house inter-residue distance and orientation predictor. A deep graph neural network is then adopted to predict both per-residue and whole-protein quality assessment scores for each candidate structure.
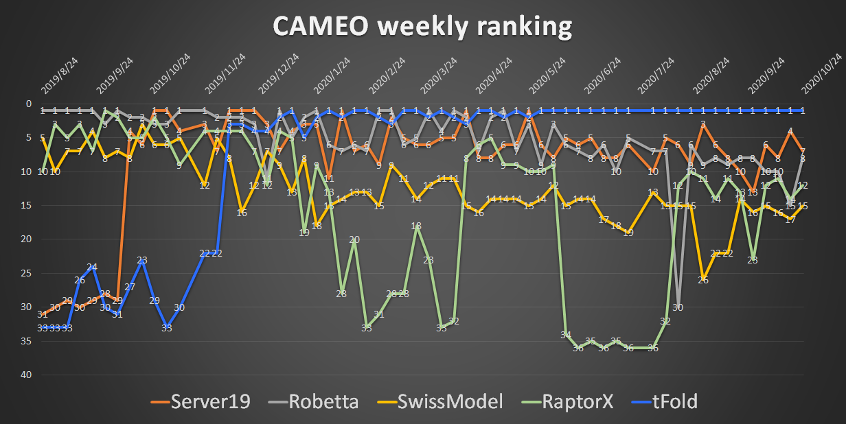
4: Evaluation results
tFold has proven its innovative value and effectiveness on CAMEO, which is an internationally recognized platform for fully automatic evaluation of protein structure prediction servers. Registered in early 2020, tFold server has maintained weekly (Figure 1), monthly, quarterly, and semi-annual champions since June 2020. It is worth noting that tFold server leads the industry's authoritative methods (e.g., Robetta) by more than 6% in general cases and more than 12% in hard cases.